Measuring Success
How we PROTECT
2023
METRIC 4
Natural Resource Protection
Track the number of adopted municipal ordinance regulations that effectively protect natural resources.
METRIC result
There has been a rise in the number of municipal ordinances with effective natural resources protection. Most of this increase is from ordinances focusing on protecting woodlands and establishing riparian buffers.

Natural Resources Protection Ordinances
METRIC 5
Stream Health
Monitor aquatic life diversity as an indicator of overall stream health.
METRIC result
Stream health data for 2023 will become available in winter 2024. The five-year trend shows a fluctuation in stream health, which overall indicates no major improvement or degradation for the stream systems as a whole.

Stream Health in Chester County Trends
* 2023 data will be available in winter 2024.
2022
METRIC 4
Natural Resource Protection
Track the number of adopted municipal ordinance regulations that effectively protect natural resources.
METRIC result
For this metric, the ordinances of all 73 municipalities were reviewed to determine if they effectively addressed five specific resources: floodplains, steeps slopes, woodlands, wetlands, and riparian buffers. During 2022, the number of ordinances with effective natural resource protection rose to 223. This represents an increase of 11, relative to the base year.

Natural Resources Protection Ordinances
METRIC 5
Stream Health
Monitor aquatic life diversity as an indicator of overall stream health.
METRIC result
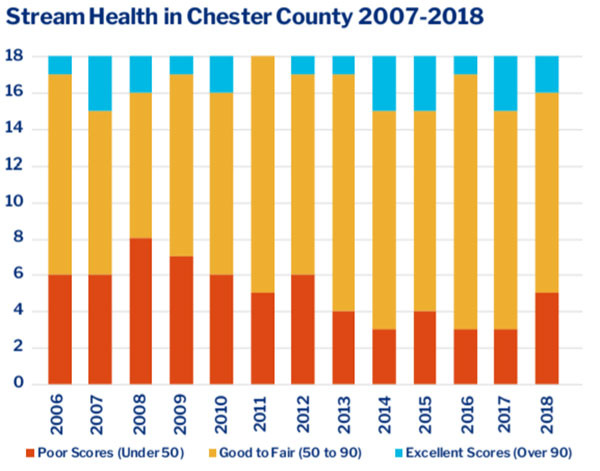
For this metric, 18 streams in the county were measured for the index of biological integrity which reflects both water quality and aquatic habitat. During 2021, the most recent year for which data is available, there were 2 excellent scores, 10 good to fair scores, and 6 poor scores.

Stream Health in Chester County Trends
2021
METRIC 4
Natural Resource Protection
Track the number of adopted municipal ordinance regulations that effectively protect natural resources.
METRIC result
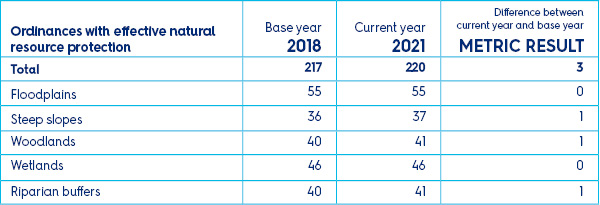
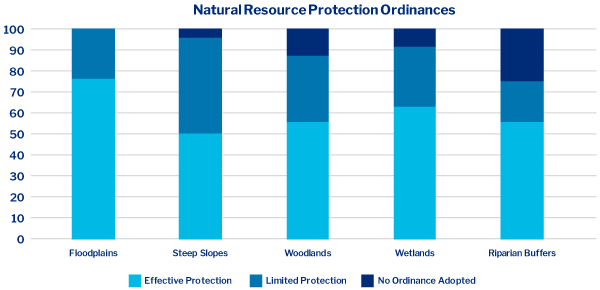
During the current year (2021), the ordinances of all 73 municipalities were reviewed to determine if they effectively addressed five specific resources: floodplains, steeps slopes, woodlands, wetlands, and riparian buffers. A total of 365 provisions were examined, and 220 were found to provide effective protection for the specific resource being examined. This represents an increase of 3, relative to the base year.
METRIC 5
Stream Health
Monitor aquatic life diversity as an indicator of overall stream health.
METRIC result
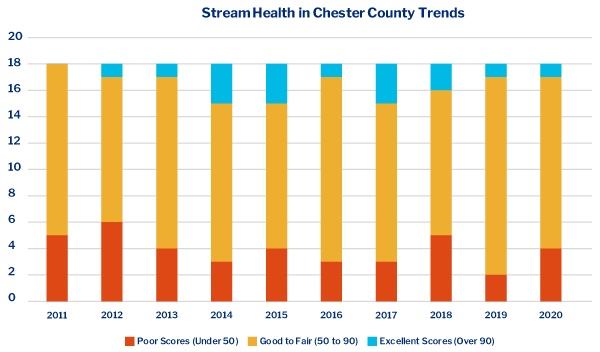
For this metric, 18 streams were measured for the index of biological integrity which reflects both water quality and aquatic habitat. Relative to the base year (2018), good to fair scores have been increasing. 2020 data was released in December 2021.

2020
METRIC 4
Natural Resource Protection
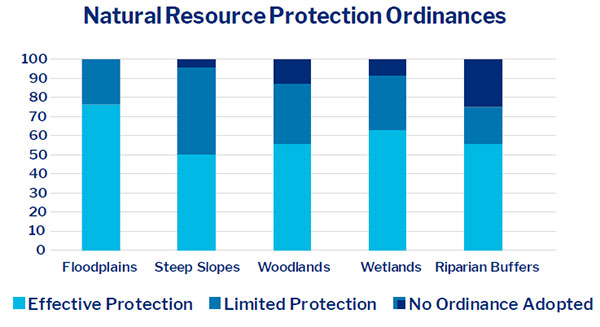
Track the number of adopted municipal ordinance regulations that effectively protect natural resources.
METRIC result
During the current year (2020), the ordinances of all 73 municipalities were reviewed to determine if they effectively addressed five specific resources: floodplains, steeps slopes, woodlands, wetlands, and riparian buffers. A total of 365 provisions were examined, and 220 were found to provide effective protection for the specific resource being examined. This represents an increase of 3, relative to the base year.

METRIC 5
Stream Health
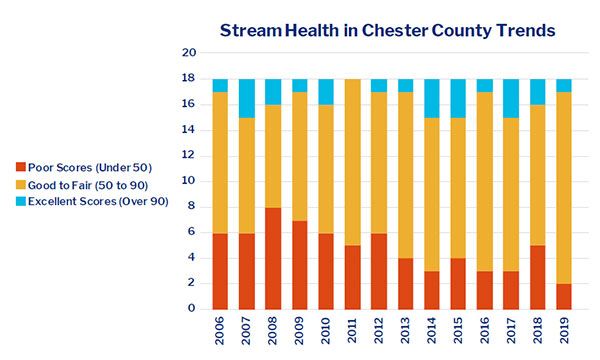
Monitor aquatic life diversity as an indicator of overall stream health.
METRIC result
For this metric, 18 streams were measured for the index of biological integrity which reflects both water quality and aquatic habitat. Relative to the base year (2018), good to fair scores have been increasing. 2019 data was released in December 2020.

2019
METRIC 4
Natural Resource Protection
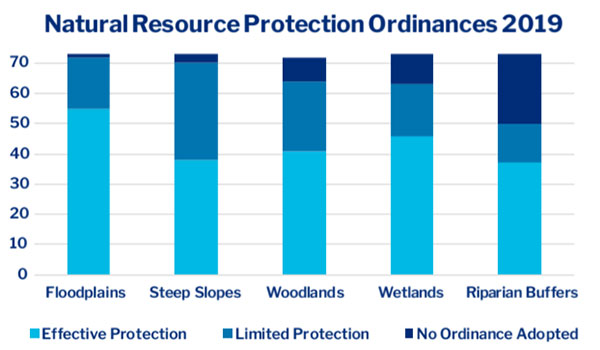
Track the number of adopted municipal ordinance regulations that effectively protect natural resources.
METRIC result
During the current year (2019), the ordinances of all 73 municipalities were reviewed to determine if they effectively addressed five specific resources: floodplains, steeps slopes, woodlands, wetlands, and riparian buffers. A total of 365 provisions were examined, and 217 were found to provide effective protection for the specific resource being examined. This represents an increase of 5, relative to the base year.

METRIC 5
Stream Health
Monitor aquatic life diversity as an indicator of overall stream health.
METRIC result
During the base year (2018), 18 streams were measured for the index of biological integrity which reflects both water quality and aquatic habitat. Of these 18, a total of 13 (72.2%) had scores that were excellent or good-to-fair. 2019 data will be published in early 2021.

